A Level top grades edge higher as mathematics and T-Levels grow, but regional gaps persist

Students in England received A Level, T Level and vocational qualification results on August 13, 2026
A Level results in England remained broadly stable in 2026, with a small rise in top grades and attainment at C or above, alongside higher participation in mathematics, STEM subjects and T Levels.
Ofqual figures show that 320,505 students at 2,835 schools and colleges received 835,950 A Level results on August 13. The proportion awarded an A or A* increased from 28.1% in 2025 to 28.3%, while 78.1% achieved a C or above, up 0.4 percentage points.
Attainment at C or above now stands 2.7 percentage points higher than in 2019, before the disruption of the COVID-19 pandemic. This year’s students spent part of their early secondary education under pandemic restrictions.
Across England, Wales and Northern Ireland, 28.5% of A Level entries were awarded an A or A*, compared with 28.3% last year. Northern Ireland recorded the highest proportion at 30.7%, followed by Wales at 29.6% and England at 28.3%.
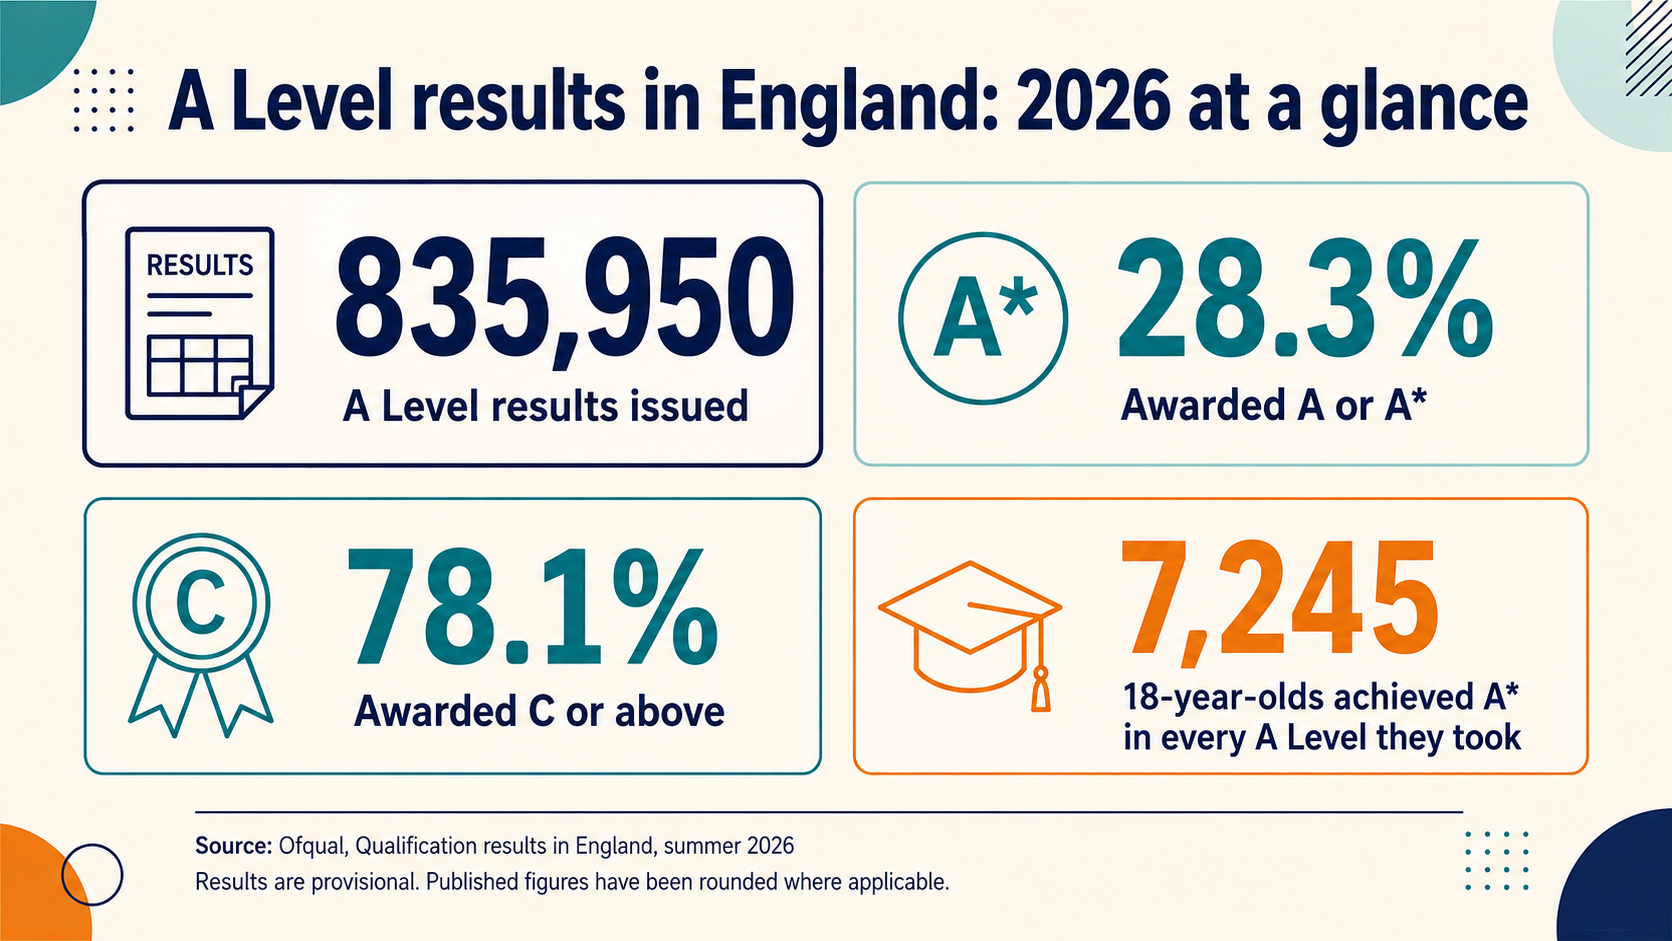
Ofqual recorded 835,950 A Level results in England in summer 2026, with 28.3% awarded A or A* and 78.1% awarded C or above
The UK-wide figures also showed a gap between male and female students at the top of the grading scale. A or A* grades accounted for 28.9% of male entries and 28% of female entries.
More than 900,000 A Level entries were recorded across England, Wales and Northern Ireland for the first time. England accounted for 835,950 of those results, an increase of 2.7% from 2025. That increase came as the population of 18-year-olds grew by 4.3%, according to projections cited by Ofqual.
Amanda Swann, Executive Director for Delivery at Ofqual, describes the overall position in England in restrained terms: “This year’s results picture is one of stability.”
Ofqual says small movements between years are normal and largely reflect changes in the groups of students taking different subjects. It maintains that the standard of work required to achieve each grade has remained consistent.
The regulator’s dataset also places A Levels within a broader level 3 system. More than 1.1 million results were issued across A Levels, AS Levels, applied generals and tech levels in England. This included 48,835 AS Level results, 195,190 applied general results and 25,905 tech level results.
Mathematics drives the movement in top grades
Mathematics remained England’s most widely taken A Level, with 107,300 students receiving results. Entries increased by 3.7% from 2025, and the subject accounted for approximately one in eight A Level results.
The proportion of mathematics results awarded an A or A* increased from 41.6% in 2025 to 42.1% in 2026. Ofqual says that change was the main factor behind the small national increase in top grades.
Ofqual attributes the result to a slightly stronger cohort rather than a change in the grade standard. Further mathematics also recorded growth, while the Department for Education says participation across science, technology, engineering and mathematics subjects increased by 3.7%.
Psychology was the second most widely taken A Level in England, with 76,100 students, followed by biology with 68,005, chemistry with 61,050 and economics with 45,915.
The five largest subjects also showed substantial differences in participation by sex. Female students accounted for 75.4% of psychology students and 64.9% of biology students. Male students represented 63.1% of mathematics students and 69.6% of economics students. Chemistry had the most even split among the five, with 56.5% female and 43.4% male.
The figures use Ofqual’s revised subject classifications, introduced to align its presentation with changes made by the Joint Council for Qualifications in 2026. Mathematics and statistics, for example, are now reported separately. Ofqual has applied the revised classifications to current and previous years, which means some subject totals differ from figures published last year.
Most students continued to follow the familiar three-subject model. Of all students receiving A Level results in England, 63.9% took three subjects, while 17.9% took two and 13.2% took one. A further 4.9% took four A Levels.
The pattern was similar among 18-year-olds, with 66.9% taking three subjects and 5.2% taking four. Students across all ages took an average of 2.61 A Levels, rising to 2.67 among 18-year-olds.
Ofqual recorded 7,245 18-year-olds who achieved an A* in every A Level they took. This included 4,195 students taking three subjects and 1,900 taking four. A further 25 students achieved an A* in each of five or more A Levels.
London and the South East remain ahead on top grades
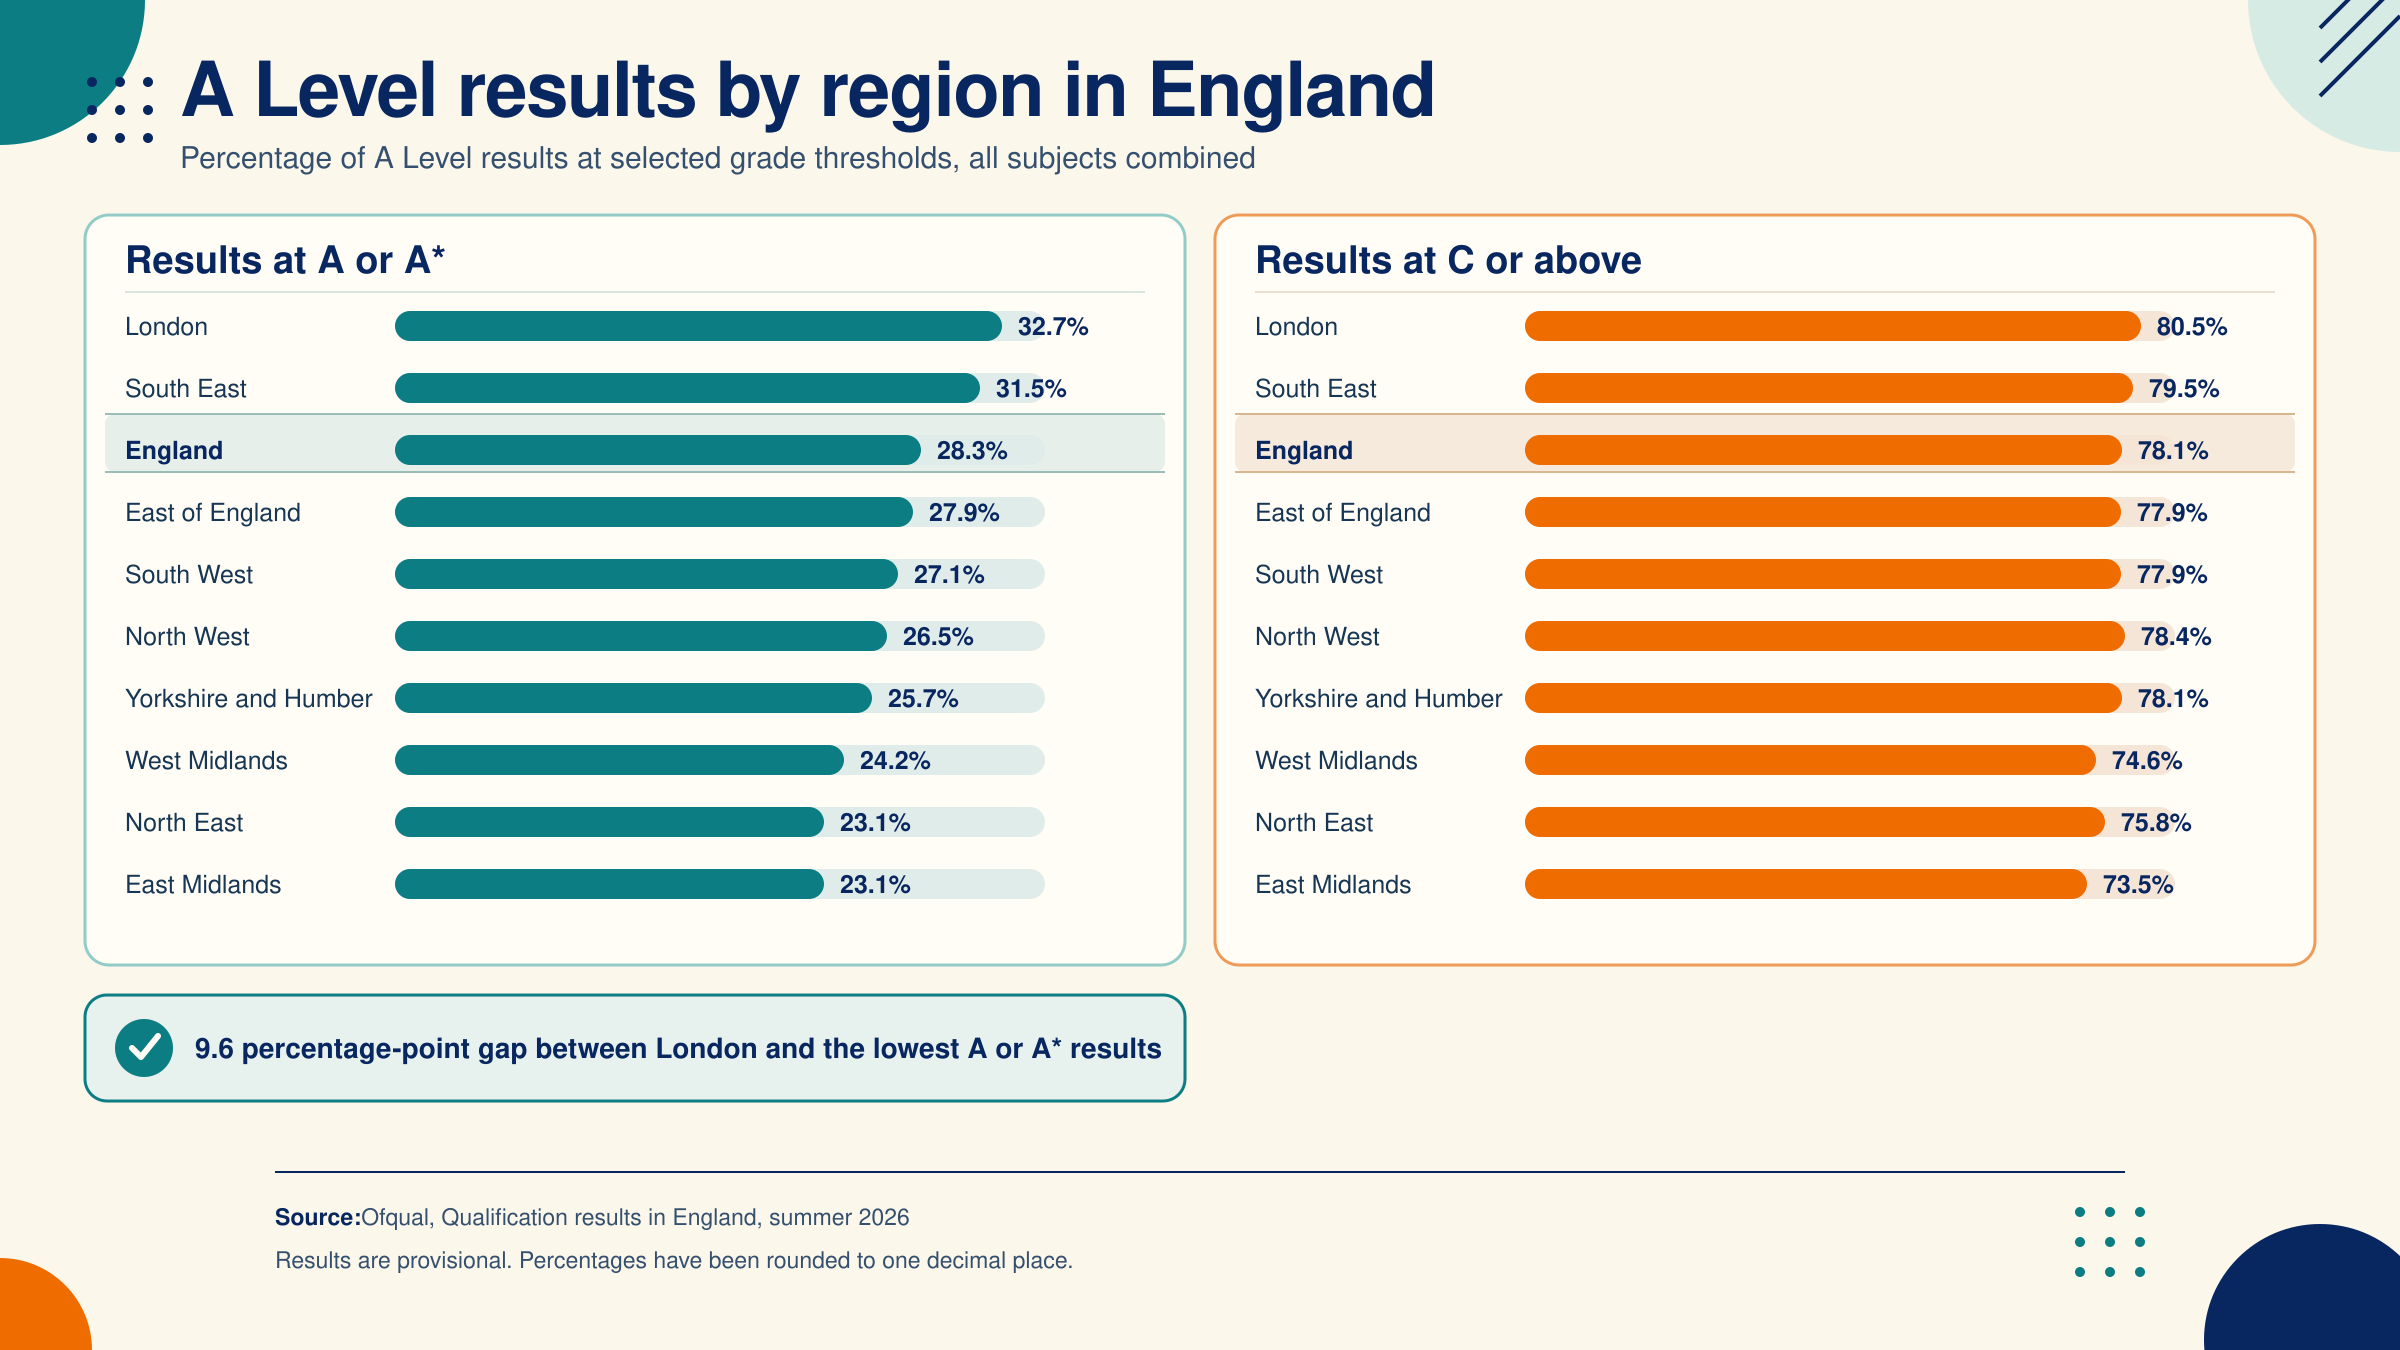
London recorded the highest proportion of A or A* results in England in 2026 at 32.7%, compared with 23.1% in the North East and East Midlands
National stability did not translate into an even regional picture. London recorded the highest proportion of A or A* results in England at 32.7%, followed by the South East at 31.5%. At the other end of the table, the North East and East Midlands each recorded 23.1%.
The share of results at C or above ranged from 80.5% in London to 73.5% in the East Midlands. The South East recorded 79.5%, while the North East stood at 75.8%.
Other regions remained closer to the national average. The East of England recorded 27.9% of results at A or A*, followed by the South West at 27.1%, the North West at 26.5% and Yorkshire and the Humber at 25.7%. The West Midlands recorded 24.2%.
The geographic divide sits alongside the government’s commitment to establish Regional Improvement for Standards and Excellence teams, focused on areas and schools where performance is weakest.
Prime Minister Andy Burnham says the government’s task is to connect talent with opportunity across different parts of the country and across university, apprenticeship and technical routes.
“The talent is there in every town and city in this country,” he says. “Our task is to match that talent with opportunity, whether that’s through university, an apprenticeship or a technical pathway that leads to a great career.”
School and college type produces another wide split
A Level outcomes also differed substantially by institution type. Independent and private schools recorded 48.6% of results at A or A*, compared with 25.4% across all state-funded institutions. Grammar schools recorded 43.4%, while sixth form colleges stood at 25.6%.
Among academies, 23.5% of results were graded A or A*. Local authority-maintained secondary comprehensive schools recorded 23%, secondary modern schools 22.4% and further education establishments 12.8%.
The differences remained visible at C or above. Independent and private schools recorded 89.4%, grammar schools 88.4% and all state-funded institutions 76.8%. Further education establishments recorded 63.8%.
Those categories need careful handling. Schools and colleges select one institution type when registering for a National Centre Number, and Ofqual notes that the classifications are self-reported and are not mutually exclusive. Some selective schools were moved into the grammar school category to improve its accuracy.
The figures therefore describe outcomes recorded under the chosen categories rather than a controlled comparison between otherwise similar students or institutions. Ofqual plans to publish a separate equalities analysis later in 2026, using prior attainment and other variables to examine outcomes for different groups.
T Level completion rises as technical routes expand
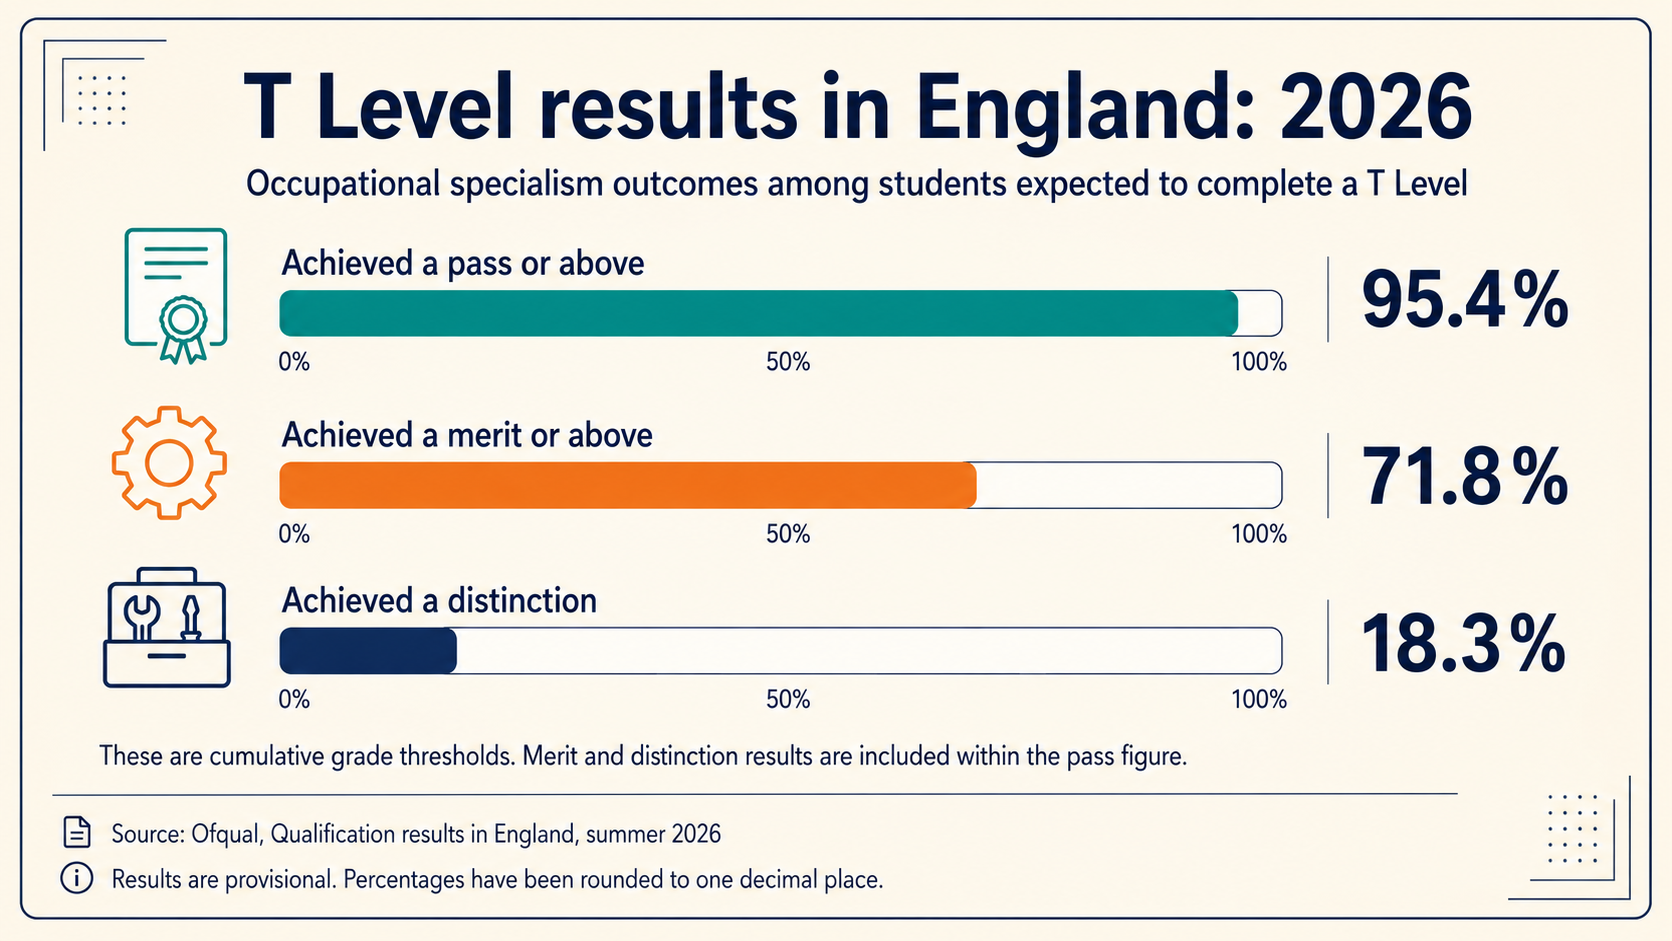
Among students expected to complete a T Level in 2026, 95.4% passed the occupational specialism and 71.8% achieved a merit or above
The largest change in the level 3 results was the growth of T Levels. Almost 20,000 students completed a T Level in 2026, more than 65% above the almost 12,000 recorded in 2025. The overall pass rate was above 90%.
Ofqual separately recorded 19,860 students receiving results for the Technical Qualification within a T Level. That figure is not directly interchangeable with the Department for Education’s overall completion total because Ofqual regulates the core and occupational specialism components but does not collect data for the required industry placement.
Among students expected to complete their T Level this summer, 95.4% passed the occupational specialism and 71.8% achieved a merit or above. Distinctions accounted for 18.3%.
For the core component, 98.7% achieved an E or above, 55.2% achieved a C or above and 7.1% received an A or A*. A* grades accounted for 0.6%.
The wider vocational and technical picture included 195,190 applied general results and 25,905 tech level results issued between March 1 and August 31.
Business, administration and law was the largest applied general subject area, with 49,145 results. Social sciences followed with 41,085, while leisure, travel and tourism recorded 27,120.
Participation remained highly differentiated by sex in several areas. Female students accounted for 92.3% of applied general results in health, public services and care. In tech levels, male students represented 94.8% of construction, planning and built environment results, 90.2% of engineering and manufacturing technology results and 82.1% of digital technology results.
Agriculture, horticulture and animal care moved in the other direction, with female students accounting for 77% of its 8,080 tech level results.
Applied generals and tech levels use several grading structures, so their top grades do not represent identical ranges of achievement. Ofqual recorded 10.1% of applied general results and 10.9% of tech level results at the top grade or grades available, but warns against treating those percentages as directly equivalent.
The dataset also counts the qualifications differently. A Level, AS Level and T Level Technical Qualification figures include passing grades and ungraded results. The applied general and tech level figures only include results at pass or above because awarding organizations do not record failures consistently across all qualifications.
Education Secretary Lucy Powell says the expansion of technical education is intended to give students a wider choice of destinations: “There is no single route to achieving your ambitions.”
Government plans include allowing students aged 14 and over to combine academic subjects with technical education connected to local employers. V Levels are expected to provide an additional vocational option from 2027, alongside an expansion of T Levels.
The government has also allocated £2.5 billion through the Youth Guarantee and Growth and Skills Levy, with the stated aim of supporting almost one million young people to earn or learn. A further £800 million is being invested in 16 to 19 education during 2026-27.
That policy push comes as more than one million people aged 16 to 24 are not in education, employment or training. Government data for January to March put the number at 1.01 million, its highest level since 2013.
University acceptances rise despite financial pressures
A record number of UK 18-year-olds secured university or college places on results day. Initial UCAS figures show 262,820 were accepted, an increase of 3% from 2025.
In England, 194,800 18-year-olds were accepted by their first-choice university, 1% more than last year. Across applicants progressing to higher education, acceptances increased by 2%.
Around 41% of UK 18-year-olds had applied to university by the end of June, a proportion broadly in line with 2025.
The increase arrived amid continued scrutiny of the cost of higher education. Undergraduate tuition fees in England and Wales will rise to £9,790 a year for students beginning courses in September. At the same time, four in ten universities in England are expected to report a deficit for the 2025-26 financial year.
Those pressures give clearing greater financial importance for institutions seeking to fill places, particularly following a decline in international student numbers. For students, the results arrive within a wider choice between university, apprenticeships, employment and expanding technical routes.
Results renew questions about AI and workplace preparation
Grades measure performance in assessed subjects, but employers and education providers are also examining how well students are being prepared for workplaces increasingly shaped by AI.
Ed Fidoe, Founder and Chief Executive of the London Interdisciplinary School, argues that the results do not capture that wider readiness: “Results Day tells students what grades they have achieved, but not whether their education has prepared them for the workplace they are entering. When people in the West Midlands are twice as likely as those in Scotland to say they feel unprepared to use AI at work, that is more than a curriculum gap; it is an opportunity gap. Education now needs to move beyond simply policing AI and give every student the judgement, confidence and critical skills to use it responsibly, regardless of postcode.”
Mathematics requirements are another point of debate, particularly in engineering. Just 36.8% of students receiving A Level mathematics results in England were female, compared with 63.1% who were male.
James Newby, President and CEO of the New Model Institute for Technology and Engineering, says students who do not take A Level mathematics, or miss the required grade, can prematurely rule themselves out of engineering.
NMITE compared its students’ performance across eight assessments spanning different years of its degree. Newby says seven showed no meaningful difference based on whether students held A Level mathematics, with students without the qualification sometimes matching or outperforming their peers in later years.
“At NMITE, not having Maths A-level doesn't disqualify you. What matters is whether you can think, design and solve problems like an engineer,” he says.
Apprenticeships remain central to the skills debate
For manufacturing and engineering employers, the route from results day to employment also includes apprenticeships combining practical training with academic study.
Phil Dingle, Future Networks Director at Lucy Electric, says the transition to clean energy is increasing demand for technical expertise: “Apprenticeships sit at the beating heart of the manufacturing and engineering sectors. They are also critical to tackling the skills shortage that threatens the UK's ability to meet growing electricity demand.
“The transition to clean energy means that school leavers have a ‘once in a generation’ opportunity to join an industry that will be vital to our future. At Lucy Electric, our apprenticeships focus on building expertise that will serve the sector for decades to come.
“Apprenticeships are not one-size-fits-all learning pathways. Aspiring apprentices can choose from a hands-on programme focused on skill development or a university-supported mix of practical and academic learning. For those looking for a resilient career with a range of paths, apprenticeships remain a strong route into the sector. However long-term Government support and investment will be needed to ensure the workforce can keep pace with demand.”
The 2026 results provide evidence of greater participation across mathematics, STEM and technical education, but also leave substantial differences by region, institution type, subject and sex visible in the data.
Ofqual’s figures remain provisional and can change following reviews or appeals. Results are also not equivalent to student numbers because many students receive several qualifications. Published counts have been rounded to the nearest five, while percentages were calculated from unrounded data.
Ofqual will update the release on August 20 with GCSE, technical award and technical certificate results. Its more detailed equalities analysis for level 3 qualifications is scheduled for later in 2026.